Skip to content
Solutions

How to forecast staffing needs from demand to schedule

Forecast demand for the same days and intervals you use to schedule work. Convert that demand into workload, calculate the productive staff required, add shrinkage and skills, then place the requirement into the schedule. After the period ends, compare forecast demand with actual demand and update the next plan.

  • Workload hours = demand ร— average task minutes รท 60
  • Productive staff = workload minutes รท interval minutes รท occupancy
You might have asked

“We schedule based on gut feel.”

“Demand changes, but staffing does not keep up.”

“We need a simple way to forecast staffing.”

What this usually means

The staffing forecast formula

For task-based work, use three connected calculations. Workload hours equal forecast demand multiplied by average task time. Productive staff equal workload minutes divided by interval minutes and target occupancy. Scheduled staff equal productive staff divided by one minus shrinkage.

For queued work with a response-time target, such as calls or live chat, simple division is not enough. Use Erlang C or Erlang A after the demand forecast because arrival patterns, waiting time, and abandonment change the number of people required.

Workload hours = demand ร— average task minutes รท 60

Productive staff = workload minutes รท interval minutes รท occupancy

Scheduled staff = productive staff รท (1 โˆ’ shrinkage)

Round the final requirement up to a whole person
Read this next

1. Forecast demand by interval

Start with historical demand at the level where staffing decisions happen. A service desk may use tickets by hour. A contact center may use calls or chats every 15 or 30 minutes. A field or project team may use jobs or work hours by day or week.

Clean obvious data errors, but do not remove real peaks only because they are inconvenient. Add known information such as holidays, campaigns, product launches, opening hours, and seasonal events. Keep a baseline forecast and record each manual adjustment so you can later test whether it helped.

What to fix

2. Convert demand into workload

Demand counts items. Staffing covers time. Convert calls, tickets, orders, visits, or tasks into workload with a recent and representative average handling or task time. Use separate times for work types that need different skills or take materially different amounts of time.

100 contacts ร— 6 minutes average handling time = 600 work minutes

600 work minutes in a 30-minute interval = 20 concurrent workload

20 รท 85% target occupancy = 24 active agents after rounding

24 รท 75% available time = 32 scheduled agents at 25% shrinkage

What to fix

3. Apply service targets, occupancy, and shrinkage

Occupancy protects people from a plan that assumes every paid minute can handle demand. Shrinkage covers paid time that is unavailable for the planned workload, such as leave, sickness, meetings, training, coaching, and breaks. Service-level rules then account for how quickly queued work must be answered.

Keep each assumption visible. A staffing requirement is much easier to review when a manager can see whether a change came from demand, handling time, occupancy, shrinkage, or the service target.

Use recent handling time by work type or skill

Set an occupancy target that leaves room for normal variation

Calculate shrinkage from your own paid-time data

Apply response-time and abandonment targets to queued work

Show a safer staffing range when demand is uncertain

Read this next

4. Turn requirements into a schedule

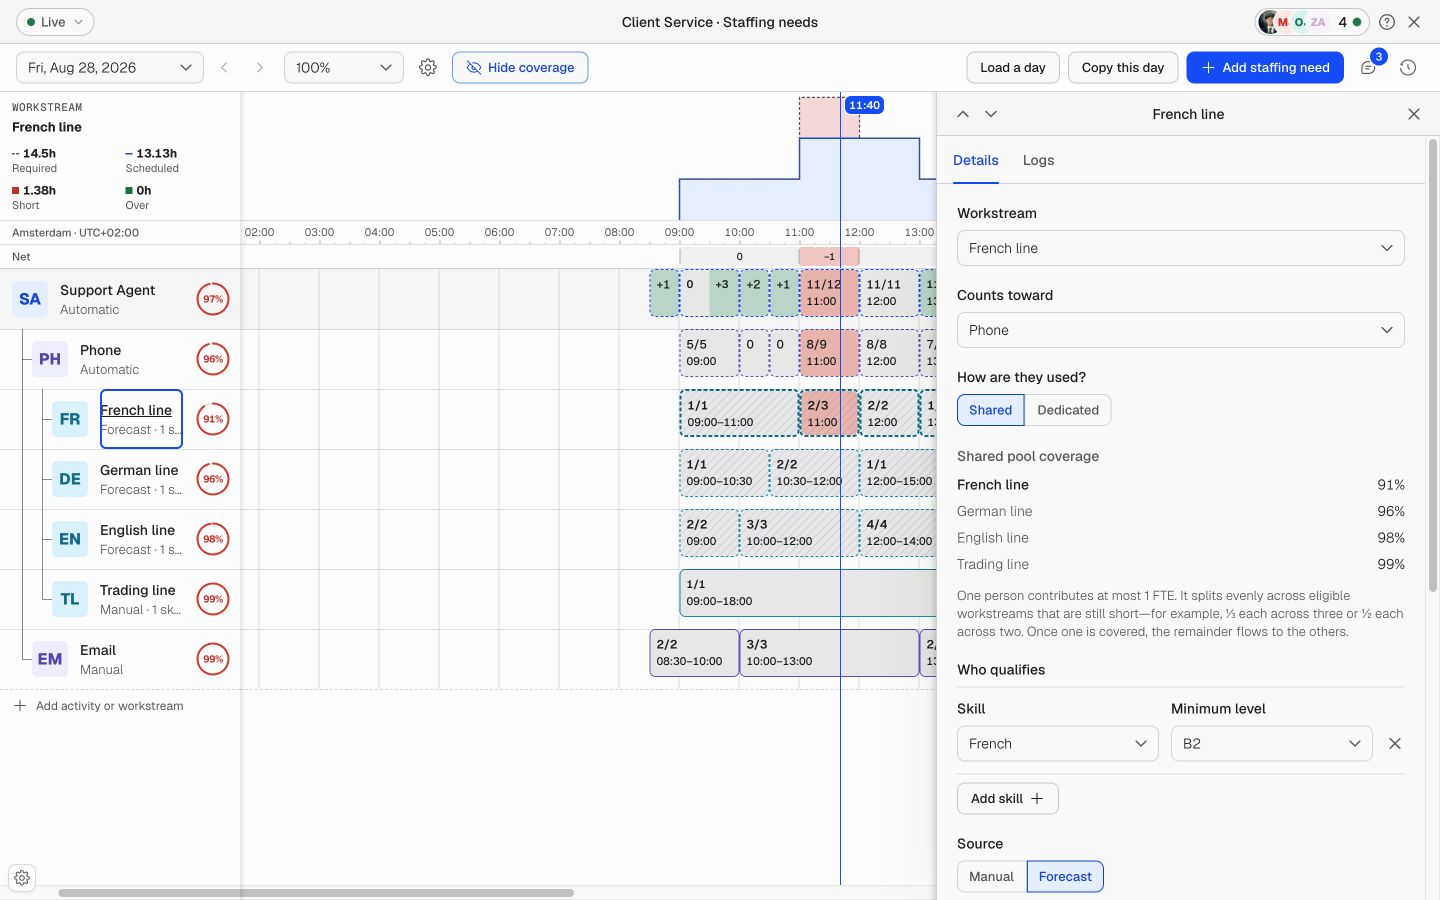
A requirement says how many people and skills are needed by interval. The schedule must place real employees against that requirement while respecting availability, contracts, breaks, leave, and shift rules. Compare required coverage with scheduled coverage before publishing the week.

Do not hide a shortage by averaging the whole day. Four extra people at 15:00 do not solve a four-person gap at 10:00. Keep the forecast, requirement, and scheduled coverage aligned at the same interval.

What to fix

5. Measure forecast error and improve the next plan

After each schedule cycle, compare forecast demand with actual demand by interval. WAPE gives a volume-weighted error measure, while bias shows whether the forecast tends to run high or low. Review both because a forecast can have an acceptable average error while repeatedly understating peaks.

Compare forecast and actual demand at the planning interval

Track WAPE for overall error and bias for direction

Review large misses by queue, day, and time of day

Separate model error from incorrect staffing assumptions

Record whether manual adjustments improved the result

Update the next forecast before the schedule cycle starts

Where it breaks

Staffing forecast mistakes to avoid

Do not forecast demand and stop there. A demand chart does not tell a manager how many people and skills must be scheduled. Do not divide weekly workload by weekly paid hours when the work arrives in peaks. The time interval matters.

Avoid one shrinkage percentage copied from an industry benchmark, one handling time for every work type, and one staffing number that hides uncertainty. Use your own operating data and show the assumptions that can change the answer.

FAQ

A few questions that usually come next

What data do I need to forecast staffing?

Historical demand by day and time, average work duration, opening hours, known events, absence assumptions, and required skills. Most of it is already sitting in your past schedules and timesheets.

How often should staffing forecasts be reviewed?

Review them before every schedule cycle and after actual demand becomes available. Operations with short demand intervals should monitor the forecast during the day and reforecast when the difference becomes material.

What is the difference between demand forecasting and staffing forecasting?

Demand forecasting estimates how much work will arrive. Staffing forecasting converts that demand into the number of people and skills required after handling time, occupancy, service targets, shrinkage, and uncertainty are applied.

How much historical data is needed for a staffing forecast?

Use enough clean history to show the patterns you expect to repeat. Several weeks may support a stable weekly pattern, while annual seasonality needs a year or more. Recent representative data is more useful than a long history from a different operation.

How should forecast accuracy be measured?

Track an error measure such as WAPE and a directional measure such as bias. Review results by interval and work type, not only as one monthly average, so repeated peak-period misses stay visible.

Should staffing forecasts include a buffer?

Yes, when demand or attendance is uncertain. Make the buffer explicit through a forecast range, shrinkage assumption, or service target. This is easier to manage than hiding extra people inside an unexplained staffing number.

Your next schedule could take 2 minutes.

Import your team, set your rules, hit auto-fill. Most teams are live the same day.

Try Soon free

30 days free ยท No credit card required

Already have an account?Sign in